NBS4Drought
Showcase 06

Riparian Wetlands Restoration to sustain downstream water resources around Świniobródka River, Poland

43 ha forest catchment restoring riparian wetlands and peatland hydration through near-natural retention and ditch blocks.

PolandTemperateRural

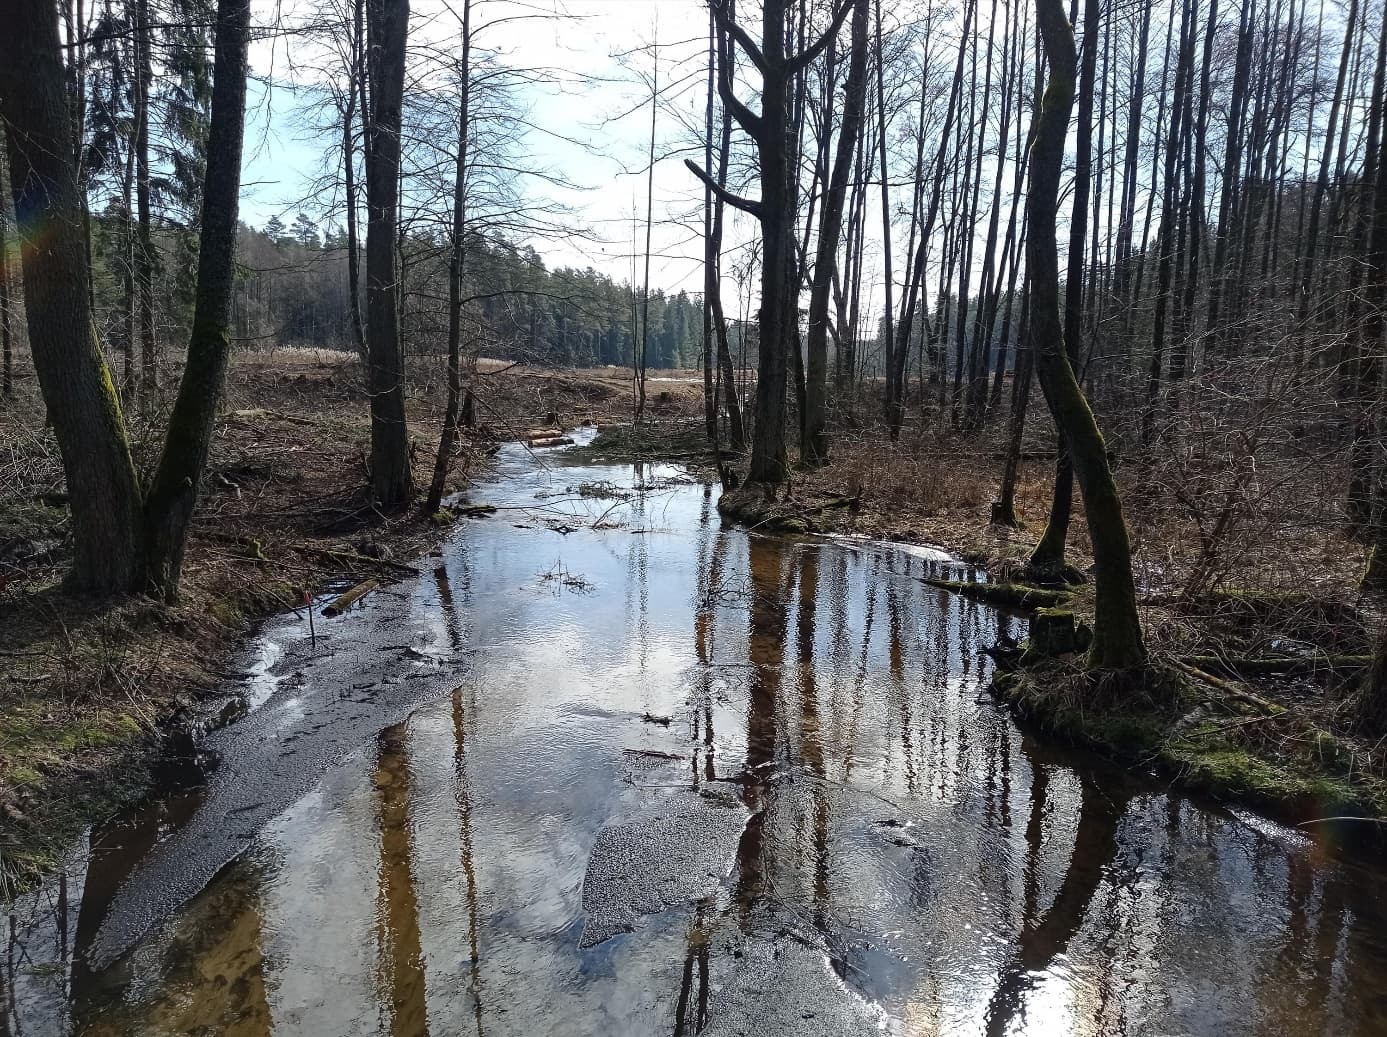
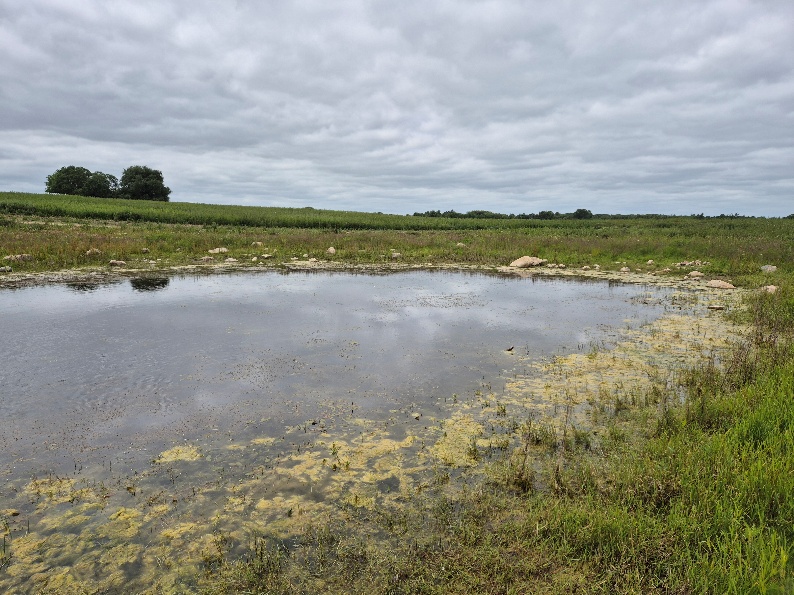
The Świniobródka River is located in the Supraśl River basin (Vistula River basin). The stream is approximately 7 km long with an average flow of about 0.2 m³/s, running through lowland forest dominated by pine, spruce, and birch. Past drainage works altered forest and marsh ecosystems; this showcase assesses existing drought-prevention measures (two small near-natural retention reservoirs) and plans new nature-based weirs from natural materials to block drainage ditches. These interventions restore riparian wetlands and proper hydration of peatlands in the catchment. Mean annual temperature is 8 °C and precipitation 560 mm.

Socio-economic monitoring shows how people access, use, perceive, and engage with this showcase. It combines partner-uploaded social indicators and accessibility analyses.

Accessibility

  • 5–10 min0.3%
  • 15–30 min18.6%
  • 45–60 min8.1%
  • 90–120 min45.5%
Published

Visitors

—

Awaiting data

Sentiment

  • Positive83.3%
  • Neutral0.0%
  • Negative16.7%
Published

Engagement

—

Awaiting data

Accessibility

Percentage of the population within each travel-time band of wetlands. Updated 21 September 2026.

Within 5–10 min

0.3%

Within 15–30 min

18.6%

Within 45–60 min

8.1%

Within 90–120 min

45.5%

Sentiment

Positive, neutral and negative opinions about wetlands. September 2025 – September 2026. Based on the external social media platforms.

Positive

83.3%

Neutral

0.0%

Negative

16.7%

Configured indicators (Socio-economic)

CodeIndicatorWhat it measuresSourceFrequencyLatest valueStatus
S1ATime accessibilityPercentage of the population within 5–10, 15–30, 45–60 and 90–120 minutes' travel time of wetlandsAccessibility analysis21 September 20265–10 min: 0.3% 15–30 min: 18.6% 45–60 min: 8.1% 90–120 min: 45.5%Published
S1BWetland visitorsNumber of visitors per yearPartner uploadAnnual—Awaiting data
S1CUsers accessibilityPotential users per km²Partner upload / External Data AnalysisAnnual—Awaiting data
S2ASentiment IndexPercentage of positive, neutral and negative opinions about wetlandsBased on the external social media platformsSeptember 2025 – September 2026Positive 83.3% Neutral 0.0% Negative 16.7%Published
S3APublic involvementParticipation in wetland-related activitiesPartner uploadAnnual—Awaiting data
S3BVirtual engagementOnline or digital engagement levelPartner uploadAnnual—Awaiting data
S3CSocial contribution to scienceNumber or percentage of public contributionsPartner uploadAnnual—Awaiting data

Related forum discussions

  • Interpreting water quality trends for this showcase
  • Biodiversity monitoring data gaps
Open Forum

Gallery

Field images and visual material

Images help communicate site context, monitoring activities, and nature-based solution interventions.

River corridor in Knyszyńska Forest

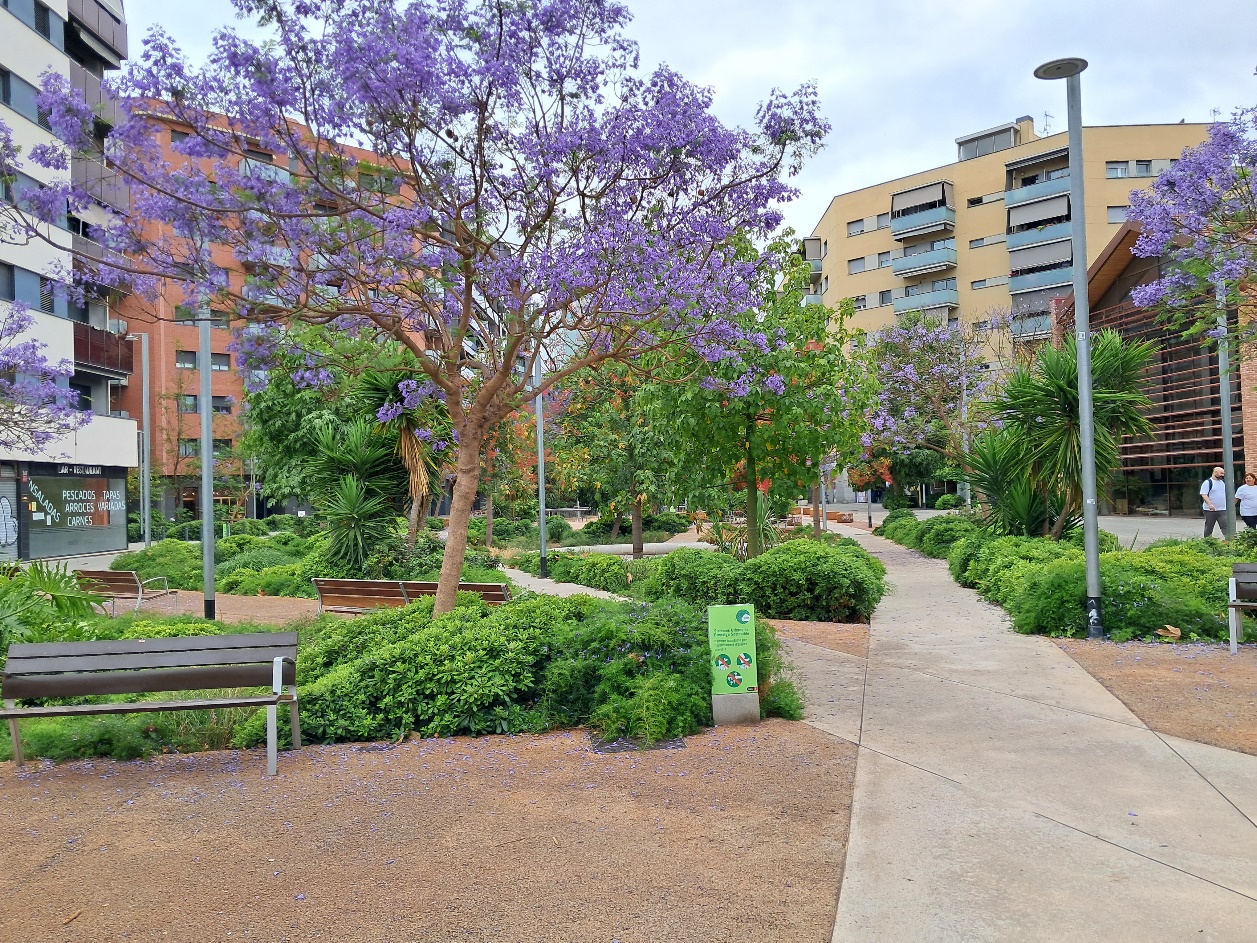
Nature-based ditch block design

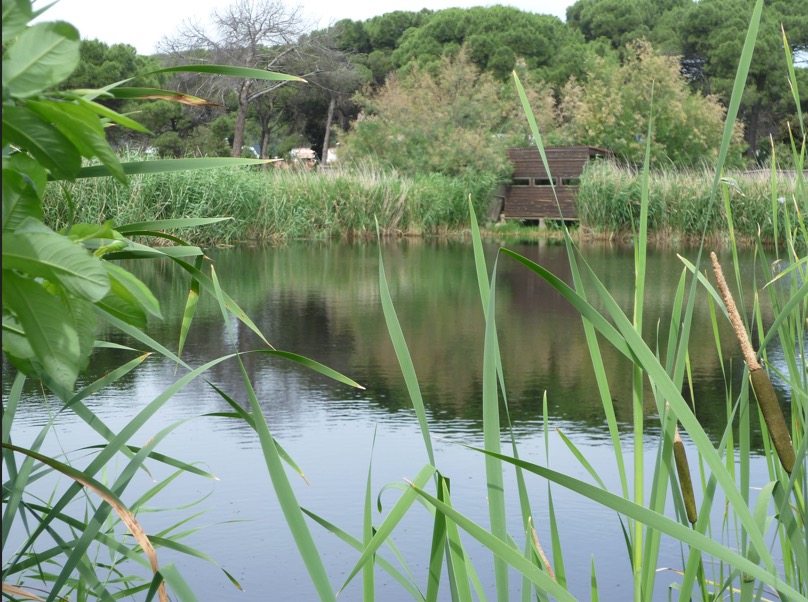
Riparian wetland restoration site