NBS4Drought
Showcase 03

Rewetting low-lying organic soils to create a green circular corridor around the city of Aarhus, Denmark

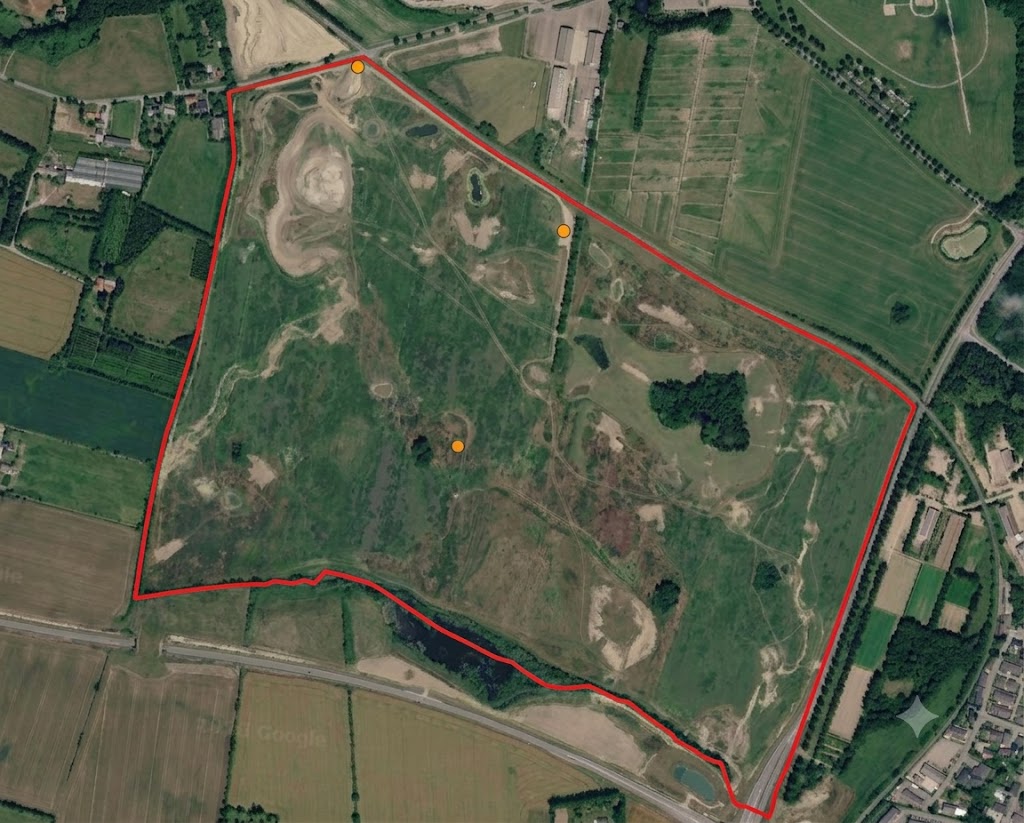
100 ha rewetting site south of Vilhelmsborg transforming former farmland into forest, ponds, meadows, and a new river valley.

DenmarkNorth temperate zonePeri-urban

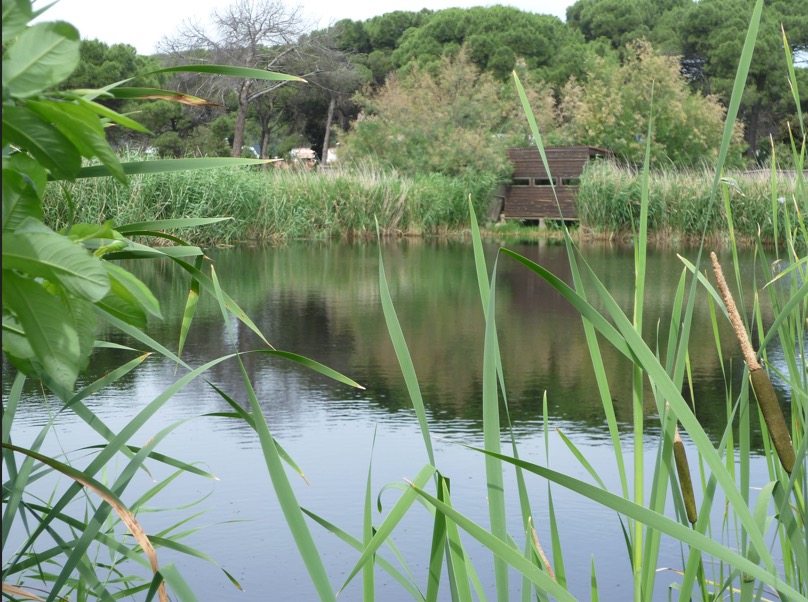
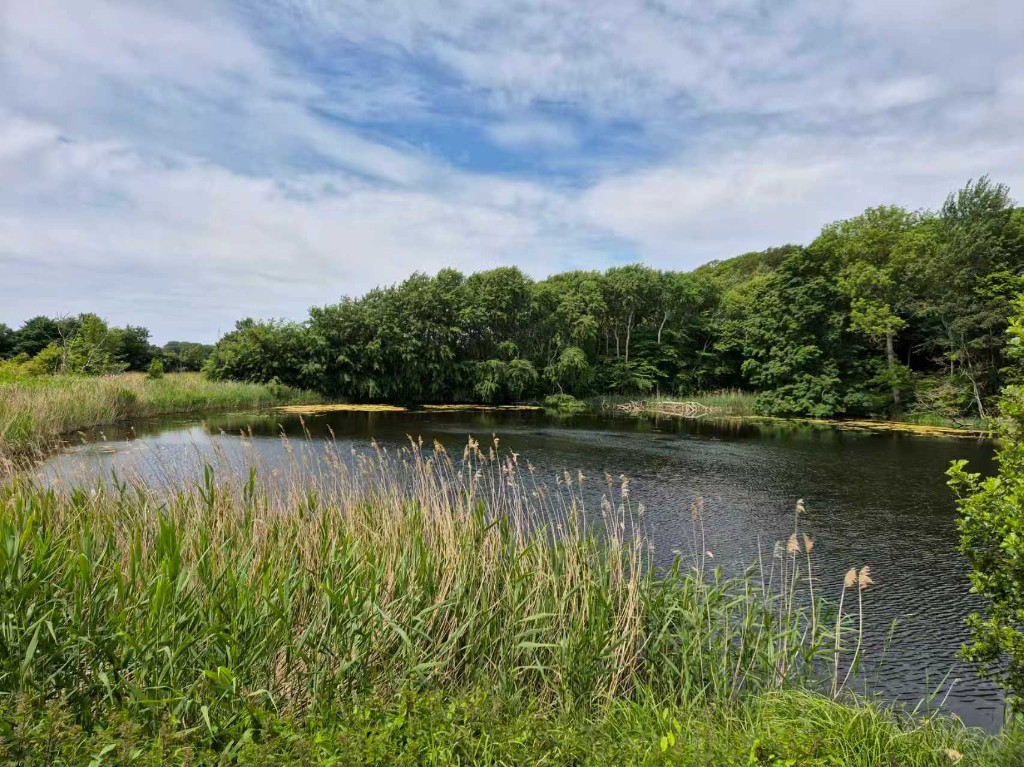
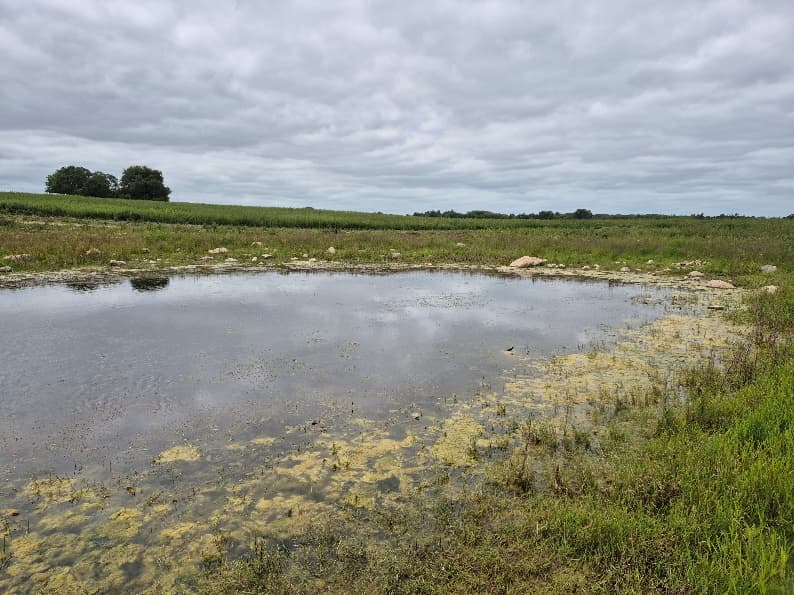
Vilhelmsborg Syd is part of Aarhus Municipality's 300 ha new nature vision. The site's original land use was arable agriculture and grazing pastures. Over time, the area south of Vilhelmsborg will become a mosaic of planted forest, self-seeded woodland, ponds, and meadows with grazing animals, preserving long views to rolling terrain and cultural-historical features. The greatest landscape transformation will come from the creation of an entirely new river valley stretching toward the Giber River, where surface water will shape natural succession. Interventions include removing or blocking drainage, excavating new ponds, natural and assisted seeding, introducing large herbivores, and afforestation.

Socio-economic monitoring shows how people access, use, perceive, and engage with this showcase. It combines partner-uploaded social indicators with geo-based survey results where available.

Accessibility

  • 5–10 min0.7%
  • 15–30 min8.6%
  • 45–60 min10.6%
  • 90–120 min38.2%
Published

Visitors

—

Awaiting data

Sentiment

—

Data not available

Survey responses

—

Survey underwayView survey dashboard

Well-being

—

Survey underwayView survey dashboard

Engagement

—

Awaiting data

Accessibility

Percentage of the population within each travel-time band of wetlands. Updated 21 September 2026.

Within 5–10 min

0.7%

Within 15–30 min

8.6%

Within 45–60 min

10.6%

Within 90–120 min

38.2%

Sentiment

Positive, neutral and negative opinions about wetlands. September 2025 – September 2026. Based on the external social media platforms.

Data not available

Geo-based survey summary

Per assessment point: anonymous aggregated mean scores for survey perception, physical well-being (S2B), and mental well-being (S2C). Individual responses are never shown.

SC3 — Giber Forest — geo-based survey map
Planned points
4
Responses
—
Coverage
0%

Assessment points — Perception

  • The car parkn=0 · —
  • The hill topn=0 · —
  • Letbane stopn=0 · —
  • Road accessn=0 · —
Survey underway
Showcase boundaryAssessment points
PositiveNeutralNegative

Configured indicators (Socio-economic)

CodeIndicatorWhat it measuresSourceFrequencyLatest valueStatus
S1ATime accessibilityPercentage of the population within 5–10, 15–30, 45–60 and 90–120 minutes' travel time of wetlandsAccessibility analysis21 September 20265–10 min: 0.7% 15–30 min: 8.6% 45–60 min: 10.6% 90–120 min: 38.2%Published
S1BWetland visitorsNumber of visitors per yearPartner uploadAnnual—Awaiting data
S1CUsers accessibilityPotential users per km²Partner upload / External Data AnalysisAnnual—Awaiting data
S2ASentiment IndexPercentage of positive, neutral and negative opinions about wetlandsBased on the external social media platformsSeptember 2025 – September 2026—Data not available
S2BPhysical well-being surveySelf-reported physical well-beingGeo-based surveySurvey-based—Survey underway
S2CMental well-being surveySelf-reported mental well-beingGeo-based surveySurvey-based—Survey underway
S3APublic involvementParticipation in wetland-related activitiesPartner uploadAnnual—Awaiting data
S3BVirtual engagementOnline or digital engagement levelPartner uploadAnnual—Awaiting data
S3CSocial contribution to scienceNumber or percentage of public contributionsPartner uploadAnnual—Awaiting data

Related forum discussions

  • Interpreting water quality trends for this showcase
  • Biodiversity monitoring data gaps
Open Forum

Gallery

Field images and visual material

Images help communicate site context, monitoring activities, and nature-based solution interventions.

New nature area south of Vilhelmsborg

Rewetting and landscape transformation

Meadows and grazing management

Site layout and intervention zones