NBS4Drought
Showcase 04

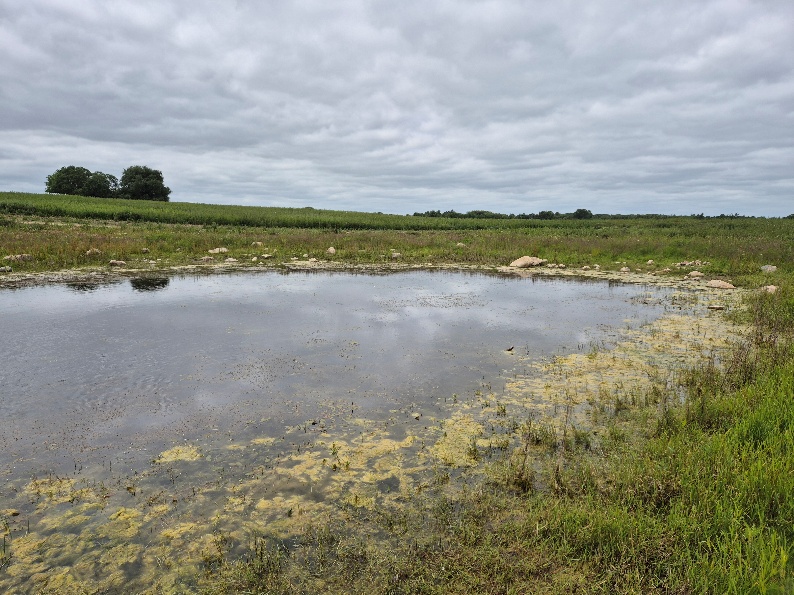
Constructing wetland reservoirs to secure agriculture production on Samsø island, Denmark

Nature-based wetland reservoirs across Samsø island supporting irrigation, nutrient retention, and biodiversity in a dry island climate.

DenmarkNorth temperate zonePeri-urban

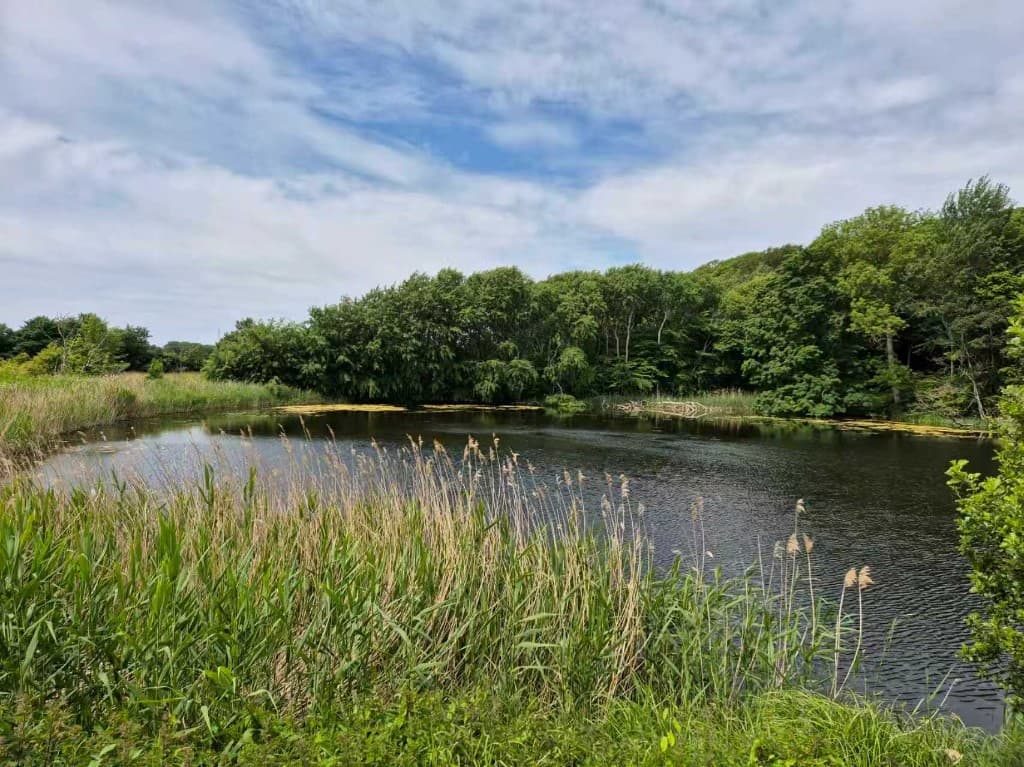
Samsø is internationally recognized as a frontrunner in sustainable energy, yet faces climate-driven pressures including limited water resources, nutrient runoff from farmland, and biodiversity loss. The island has a drier climate than much of Denmark, making spring and summer irrigation essential for crop cultivation. This showcase covers approximately 85 nature-based wetland reservoirs established from the late 1970s onward by farmers to secure irrigation water, support nitrogen cycling, and maintain biodiversity. Reservoir design, depth, connectivity, and catchment relationships are studied to develop practical guidance for climate-resilient farming.

Socio-economic monitoring shows how people access, use, perceive, and engage with this showcase. It combines partner-uploaded social indicators and accessibility analyses.

Accessibility

  • 5–10 min47.1%
  • 15–30 min0.0%
  • 45–60 min0.0%
  • 90–120 min0.0%
Published

Visitors

—

Awaiting data

Sentiment

  • Positive100.0%
  • Neutral0.0%
  • Negative0.0%
Published

Engagement

—

Awaiting data

Accessibility

Percentage of the population within each travel-time band of wetlands. Updated 21 September 2026.

Within 5–10 min

47.1%

Within 15–30 min

0.0%

Within 45–60 min

0.0%

Within 90–120 min

0.0%

Sentiment

Positive, neutral and negative opinions about wetlands. September 2025 – September 2026. Based on the external social media platforms.

Positive

100.0%

Neutral

0.0%

Negative

0.0%

Configured indicators (Socio-economic)

CodeIndicatorWhat it measuresSourceFrequencyLatest valueStatus
S1ATime accessibilityPercentage of the population within 5–10, 15–30, 45–60 and 90–120 minutes' travel time of wetlandsAccessibility analysis21 September 20265–10 min: 47.1% 15–30 min: 0.0% 45–60 min: 0.0% 90–120 min: 0.0%Published
S1BWetland visitorsNumber of visitors per yearPartner uploadAnnual—Awaiting data
S1CUsers accessibilityPotential users per km²Partner upload / External Data AnalysisAnnual—Awaiting data
S2ASentiment IndexPercentage of positive, neutral and negative opinions about wetlandsBased on the external social media platformsSeptember 2025 – September 2026Positive 100.0% Neutral 0.0% Negative 0.0%Published
S3APublic involvementParticipation in wetland-related activitiesPartner uploadAnnual—Awaiting data
S3BVirtual engagementOnline or digital engagement levelPartner uploadAnnual—Awaiting data
S3CSocial contribution to scienceNumber or percentage of public contributionsPartner uploadAnnual—Awaiting data

Related forum discussions

  • Interpreting water quality trends for this showcase
  • Biodiversity monitoring data gaps
Open Forum

Gallery

Field images and visual material

Images help communicate site context, monitoring activities, and nature-based solution interventions.

Water reservoir

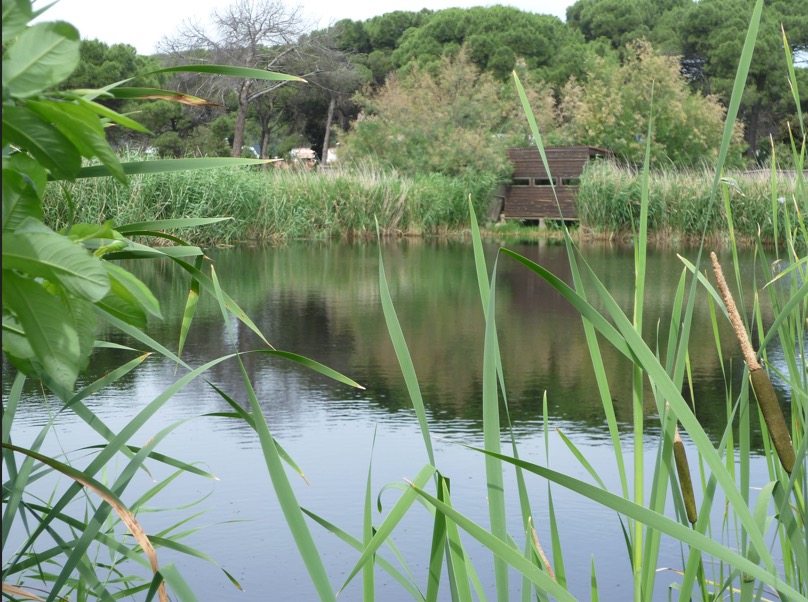
Water reservoir